
More Information
Submitted: April 10, 2023 | Approved: April 27, 2023 | Published: April 28, 2023
How to cite this article: Esmaeili F, Bayat N, Rahimipour K, Norouzi F. Quality and quantity of bone at intraoral graft donor sites in type 2 diabetic patients versus healthy controls: A cone-beam computed tomography study. J Oral Health Craniofac Sci. 2023; 8: 007-015.
DOI: 10.29328/journal.johcs.1001043
Copyright License: © 2023 Esmaeili F, et al. This is an open access article distributed under the Creative Commons Attribution License, which permits unrestricted use, distribution, and reproduction in any medium, provided the original work is properly cited.
Keywords: Bone transplantation; Diabetes mellitus; Type 2; Palate; Cone-beam computed tomography

Quality and quantity of bone at intraoral graft donor sites in type 2 diabetic patients versus healthy controls: A cone-beam computed tomography study
Farzad Esmaeili1 , Narges Bayat2, Kasra Rahimipour2 and Farnaz Norouzi3*
1DDS, Associate Professor, School of Dentistry, Department of Oral and Maxillofacial Radiology, Tabriz University of Medical Sciences, Tabriz, Iran
2DDS, Department of Oral and Maxillofacial Radiology, School of Dentistry, Tabriz University of Medical Sciences, Tabriz, Iran
3DDS, Department of Dental Biomaterials, Faculty of Dentistry, Tabriz University of Medical Sciences, Tabriz, Iran
*Address for Correspondence: Farnaz Norouzi, DDS, Department of Dental Biomaterials, Faculty of Dentistry, Tabriz University of Medical Sciences, Tabriz, Iran, Email: [email protected]
Objectives: This study aimed to compare the quality and quantity of bone at intraoral autogenous graft donor sites in type II diabetes mellitus (DM) patients versus healthy controls using cone-beam computed tomography (CBCT).
Materials and methods: This case-control study was conducted on CBCT scans of 50 DM patients and 50 healthy controls between 20-70 years. Maximum height, width, length, and volume of harvestable bone at the symphysis, ramus, palate, and tuberosity were measured bilaterally. The Hounsfield unit (HU) was also calculated to assess bone quality. The two groups were compared regarding the quality and quantity of harvestable bone using an independent t-test. The effect of confounders was analyzed by the regression model (alpha = 0.05).
Results: DM patients had significantly lower harvestable bone volume at the symphysis, ramus, and tuberosity than healthy controls (p < 0.001) but this difference was not significant at the palate (p = 0.957). Also, bone quality was significantly lower at the symphysis, ramus, palate, and tuberosity in DM patients (p < 0.001).
Conclusion: Diabetic patients had significantly lower bone quality and quantity at intraoral graft donor sites than healthy controls. Mandibular symphysis had higher bone volume and density than ramus, palate, and tuberosity for graft harvesting in diabetic patients.
Bone grafting is a commonly practiced procedure for the treatment of bone defects caused by atrophy, trauma, congenital anomalies, or neoplasms [1]. Autogenous bone is the most reliable option for the reconstruction of bone defects [2]. It is the gold standard for grafting due to its osteoconductive, osteoinductive, and osteogenic properties and a success rate of over 95% even in cases with severe vertical and horizontal bone resorption [3,4]. Moreover, autogenous bone grafts do not elicit any immune reaction and contain osteoprogenitor cells along with growth factors [5].
Several intraoral and extraoral donor sites are available for graft harvesting [6]. Extraoral donor sites can provide higher amounts of bone; however, they have numerous drawbacks such as higher cost of the procedure, significant donor site morbidity, and creation of a second surgical site. Intraoral donor sites can provide a significantly lower volume of bone; however, they have the advantage of minimal side effects and complications. Also, bone harvesting from the oral cavity can shorten the duration of the procedure and requires less surgical manipulation [7,8].
Intraoral donor sites are commonly used for the reconstruction of maxillofacial bone defects, alveolar ridge augmentsation, and ridge reconstruction [9]. The amount of bone required at the recipient site and the biological quality of the harvested bone are two important factors to consider before selecting an intraoral donor site for autogenous bone harvesting [10]. Mandibular ramus and symphysis, mandible, maxillary tuberosity, and the palate are the main intraoral donor sites [11].
The dimensions of the intraoral donor site, the volume of harvestable bone, and the approximation of intraoral donor sites to anatomical structures can be accurately assessed by cone-beam computed tomography (CBCT) [5]. CBCT provides precise information regarding anatomical structures, bone morphology, anatomical variations, and pathologies [12,13]. Also, valuable information can be obtained regarding bone mineral density (BMD) by calculation of Hounsfield unit (HU) on CBCT scans [14].
Systemic conditions such as diabetes mellitus (DM) can adversely affect the quality and quantity of bone [15]. DM is the most common metabolic disorder and a major health dilemma worldwide [16]. It has serious complications such as diabetic retinopathy, nephropathy, neuropathy, macrovascular diseases, and wound healing impairment. Furthermore, comorbidity of DM with other human diseases occurs frequently aggravating the treatment [17]. DM is associated with a series of skeletal complications such as reduction in BMD, increased risk of osteopenia and osteoporosis, impaired bone healing, and impaired bone regeneration and remodeling [18]. Also, it is believed that delayed wound healing and impaired function of neutrophils in DM are associated with periodontal disease, periodontal abscess, and implant failure [19]. Considering the high number of diabetic patients, knowledge about the effects of DM on bone quality and quantity is imperative, especially in patients requiring bone grafting and dental implants.
Considering the absence of a comprehensive study on the effects of DM on the quality and quantity of bone at all intraoral donor sites and the presence of some controversy in this regard, this study aimed to compare the quality and quantity of bone at intraoral graft donor sites in type 2 DM patients versus healthy controls using CBCT.
This case-control study was approved by the ethics committee of ** University of Medical Sciences (The code is provided in the Cover Letter). (In order to blind the manuscript, “***” is used in this file. The missing information is provided in the Cover Letter of this submission.)
The sample size was calculated to be 42 in each group according to a study by Rai, et al. [15] assuming the mean and standard deviation of BMD to be 1395.368 ± 296.97 in the case group, and 1608.572 ± 380.36 in the control group, alpha = 0.05, and study power of 80%. Considering 20% dropouts, 50 individuals were considered for each group. The study was carried out from September 2021 to March 2022.
Eligibility criteria
The inclusion criteria were age between 20 to 70 years, no history of bone grafting or sinus surgery, no history of jaw fracture, no systemic disease (except for type 2 DM in the case group) and having CBCT scans taken for purposes not related to this study.
The exclusion criteria were complete edentulism, poor-quality CBCT scans and the presence of motion artifacts.
Study groups
The study was conducted on 100 individuals including 50 type 2 DM patients and 50 healthy controls. Patients assigned to the case group had to have HbA1c levels ≥ 6.5%.
All CBCT scans had been taken with a NewTom VGi CBCT scanner (Verona, Italy) with a flat-panel 1920x1536-pixel detector, 360-degree rotation, 18-second scanning time, and maximum voltage of 110 kVp at the Oral and Maxillofacial Radiology Department of School of Dentistry, *** University of Medical Sciences. (In order to blind the manuscript, “***” is used in this file. The missing information is provided in the Cover Letter of this submission.) The scanner adjusted the exposure settings. Images were reconstructed by NNT Viewer version 8.0.0 software.
Measuring the dimensions of harvestable bone from mandibular symphysis
The maximum harvestable bone width from the symphysis was measured from the buccal surface of the mandible to 2 mm buccal to the lingual plate of the mandible on cross-sectional images (Figure 1a, line 1).
The maximum symphyseal bone height was measured on cross-sectional images from 5 mm apical to the apex of the incisor to 2 mm coronal to the base of the mandible (Figure 1a line 2).
The maximum symphyseal bone length was measured on the axial view from 5 mm mesial to the right mental foramen to 5 mm mesial to the left mental foramen (Figure 1b, line 3).
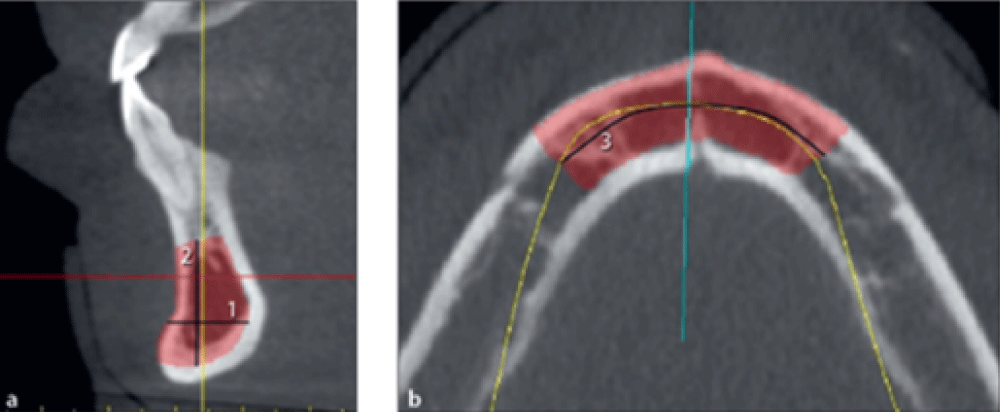
Figure 1: Measuring the width, height, and length of harvestable bone from the symphysis.
The maximum bone volume was measured in square centimeters by marking a bone block on each scan using Mimics 10.01 software.
Measuring the dimensions of harvestable bone from mandibular ramus
Dimensions of harvestable bone from the mandibular ramus were measured on both sides.
The maximum harvestable bone width from the ramus was measured on cross-sectional images in millimeters from the buccal surface of the mandible to the 2 mm buccal to the lingual plate of the mandible (Figure 2a, line 1).
The maximum harvestable bone height was measured on cross-sectional images in millimeters from the alveolar crest to 2 mm above the mandibular canal (Figure 2a, line 2).
The maximum harvestable bone length was measured on the panoramic view in millimeters. The mesial limit was 2 mm distal to the most distal molar tooth. The distal limit was the point at the cross-section of the cranial surface of the mandible with the first reconstructed buccal surface on CBCT scans with continuous visualization of the ascending ramus. A line was drawn from this point perpendicular to the mandibular canal. The distance between the mesial limit and this vertical line was considered the maximum length of harvestable bone from the ramus (Figure 2b, line 3).
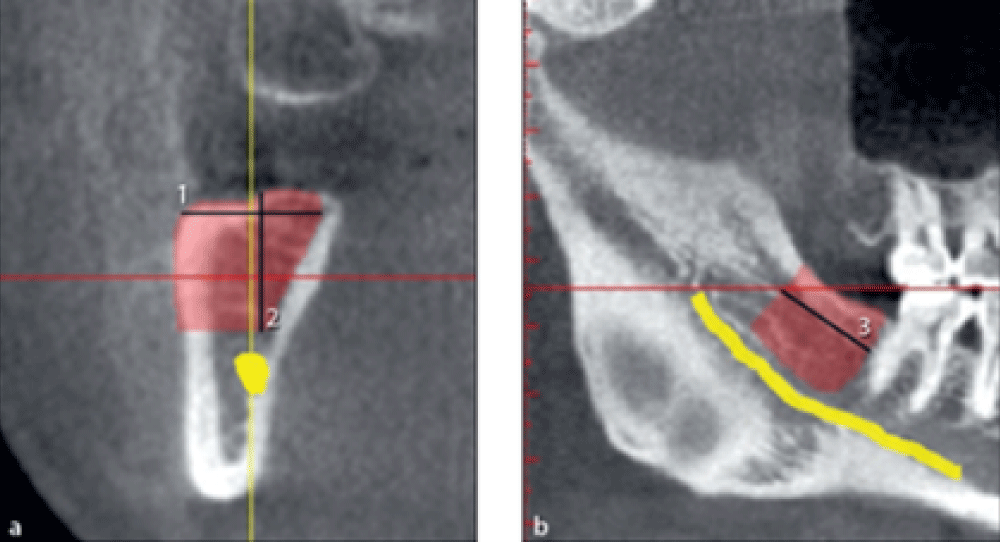
Figure 2: Measuring the width, height, and length of harvestable bone from the mandibular ramus.
The maximum volume in square centimeters was measured by marking a bone block on each scan using Mimics 10.01 software.
Measuring the dimensions of harvestable bone from the palate
Dimensions of harvestable bone from the palate were measured bilaterally.
The maximum width of harvestable bone from the palate was measured on cross-sectional images in millimeters from the palatal surface to 2 mm of the buccal plate or 2 mm of the root surface (Figure 3a, line 1).
The maximum harvestable bone height from the palate was measured on cross-sectional images in millimeters from the palatal surface to 2 mm to the sinus or nasal cavity (Figure 3a, line 2).
The maximum harvestable bone length from the palate was measured on the axial view in millimeters from the distal border of the second premolar to 2 mm of the incisive foramen (Figure 3b, line 3).
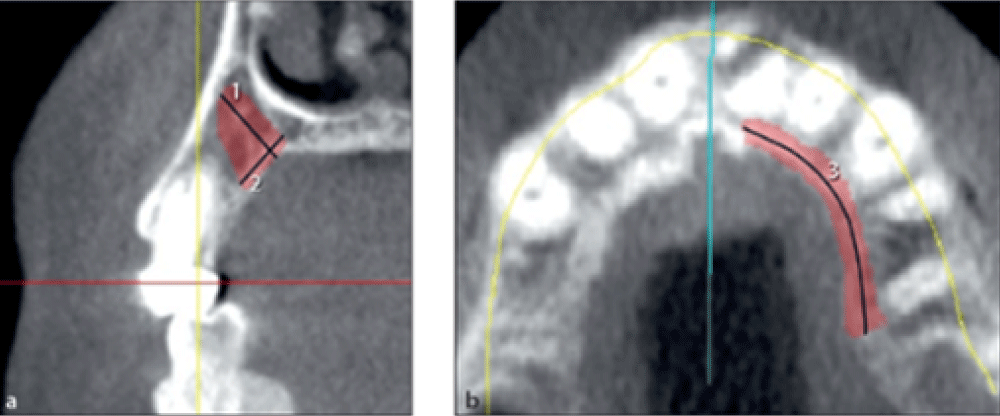
Figure 3: Measuring the width, height, and length of harvestable bone from the palate.
The maximum volume was measured in square centimeters by marking a bone block on each scan using Mimics 10.01 software.
Measuring the dimensions of harvestable bone from the maxillary tuberosity
This variable was also measured bilaterally.
The maximum harvestable bone width from the tuberosity was quantified on cross-sectional images in millimeters by measuring the buccolingual width of the maxillary alveolar crest (Figure 4a, line 1).
The maximum harvestable bone height from the tuberosity was quantified on cross-sectional images in millimeters from the bone crest to 2 mm from the sinus cavity (Figure 4a, line 2).
The maximum harvestable bone length from the tuberosity was measured on the panoramic view in millimeters from 2 mm distal to the most distal tooth to the distal border of the tuberosity (Figure 4b, line 3).
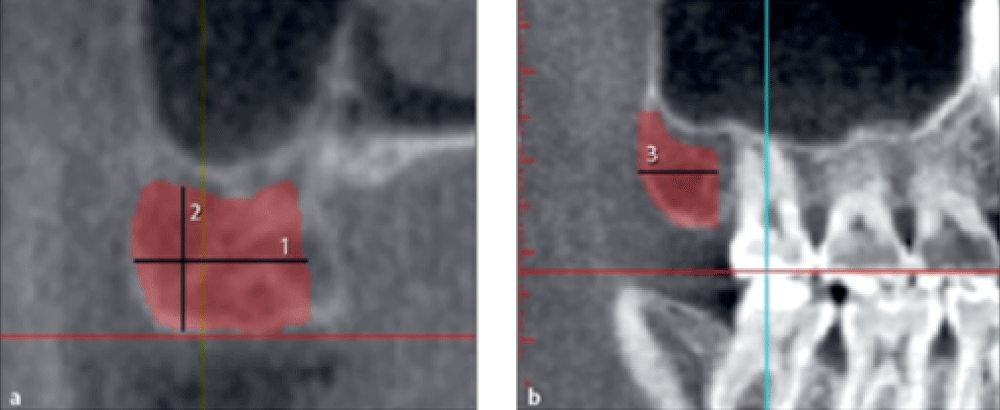
Figure 4: FibrohyalinizedMeasuring the width, height, and length of harvestable bone from the tuberosity.
The maximum volume was measured in square centimeters by marking a bone block on each scan using Mimics 10.01 software.
Assessment of the quality of harvestable bone
The quality of harvestable bone from the ramus, symphysis, tuberosity, and palate was assessed by measuring the HU using NNT Viewer version 8.0.0 software. The quality of harvestable bone was measured bilaterally for the ramus, tuberosity, and palate, while the quality of harvestable bone from the symphysis was measured as mono-block.
Statistical analysis
An Independent t-test was used to compare the harvestable bone quality and quantity between the two groups. A multivariate generalized linear regression model (GLM) was applied to control for the effect of age and gender on bone quality and quantity. Statistical analyses were carried out using SPSS version 15 at a 0.05 level of significance.
A total of 100 patients were evaluated in two groups of case and control (n = 50) with a mean age of 48.29±13.69 years; the mean age was 45.12 ± 14.81 years in healthy controls and 51.46 ± 11.86 years in the diabetic group (p = 0.020). A total of 48 females and 52 males were evaluated including 24 females and 26 males in each group (p > 0.05).
uality and quantity of harvestable bone from the symphysis
Table 1 presents the mean dimensions and BMD of harvestable bone from the symphysis.
| Table 1: Mean dimensions and BMD of harvestable bone from the symphysis | |||||
| Group | Gender | N | Mean | Std. Deviation | |
| Symphyseal width | Healthy | Female | 24 | 10.02 | 0.91 |
| Male | 26 | 10.73 | 0.68 | ||
| Diabetic | Female | 24 | 9.51 | 1.02 | |
| Male | 26 | 9.89 | 0.77 | ||
| Symphyseal height | Healthy | Female | 24 | 12.54 | 1.15 |
| Male | 26 | 13.93 | 1.68 | ||
| Diabetic | Female | 24 | 11.59 | 0.98 | |
| Male | 26 | 11.95 | 0.93 | ||
| Symphyseal length | Healthy | Female | 24 | 32.03 | 1.72 |
| Male | 26 | 33.21 | 1.81 | ||
| Diabetic | Female | 24 | 30.98 | 1.83 | |
| Male | 26 | 31.91 | 1.58 | ||
| Symphyseal volume | Healthy | Female | 24 | 3.61 | 0.90 |
| Male | 26 | 4.57 | 1.11 | ||
| Diabetic | Female | 24 | 2.97 | 0.75 | |
| Male | 26 | 3.29 | 0.60 | ||
Symphyseal width: The effect of the group on symphyseal width was statistically significant such that the mean symphyseal width of healthy controls was 0.330 units higher than diabetic patients after controlling for the effect of confounders including age, gender, and laterality (p = 0.004).
The effect of gender on symphyseal width was significant such that the mean symphyseal width in females was 0.505 units smaller than that in males after controlling for other variables (p < 0.001).
The effect of age on symphyseal width was significant such that the mean symphyseal width decreased by 0.049 units with each one-year increase in age after controlling for other variables (p < 0.001).
Symphyseal height: The effect of the group on symphyseal height was statistically significant such that the mean symphyseal height of healthy controls was 0.989 units higher than diabetic patients after controlling for the effect of confounders (p < 0.001).
The effect of gender on symphyseal height was significant such that the mean symphyseal height in females was 0.818 units higher than that in males after controlling for other variables (p < 0.001).
The effect of age on symphyseal height was significant such that the mean symphyseal height increased by 0.085 units with each one-year increase in age after controlling for other variables (p < 0.001).
Symphyseal volume: The effect of the group on symphyseal volume was statistically significant such that the mean symphyseal volume of healthy controls was 0.594 units higher than diabetic patients after controlling for the effect of confounders (p < 0.001).
The effect of gender on symphyseal volume was significant such that the mean symphyseal volume in females was 0.591 units higher than that in males after controlling for other variables (p < 0.001).
The effect of age on symphyseal volume was significant such that the mean symphyseal volume increased by 0.053 units with each one-year increase in age after controlling for other variables (p < 0.001).
Quality of symphyseal bone: GLM revealed that the effects of group (p < 0.001), gender (p < 0.001), and age (p < 0.001) on the quality of symphyseal bone were statistically significant such that the BMD was 46.007 units lower in diabetic patients and 41.50 units higher in males. Also, each one-year increase in age decreased BMD by an average of 4.07 units.
Quality and quantity of harvestable bone from the ramus
Table 2 presents the mean dimensions and BMD of harvestable bone from the ramus.
| Table 2: Mean dimensions and BMD of harvestable bone from the ramus. | ||||||
| Group | Gender | Location | N | Mean | Std. Deviation | |
| Ramus width | Healthy | Female | Right | 24 | 9.70 | 0.75 |
| Left | 24 | 9.69 | 0.75 | |||
| Male | Right | 26 | 10.07 | 0.80 | ||
| Left | 26 | 10.13 | 0.80 | |||
| Diabetic | Female | Right | 24 | 9.09 | 1.05 | |
| Left | 24 | 9.15 | 1.12 | |||
| Male | Right | 26 | 9.36 | 0.63 | ||
| Left | 26 | 9.35 | 0.65 | |||
| Ramus height | Healthy | Female | Right | 24 | 11.86 | 1.41 |
| Left | 24 | 11.84 | 1.37 | |||
| Male | Right | 26 | 12.24 | 1.93 | ||
| Left | 26 | 12.22 | 1.96 | |||
| Diabetic | Female | Right | 24 | 10.93 | 1.26 | |
| Left | 24 | 10.91 | 1.15 | |||
| Male | Right | 26 | 11.02 | 1.29 | ||
| Left | 26 | 11.29 | 1.84 | |||
| Ramus length | Healthy | Female | Right | 24 | 9.18 | 1.73 |
| Left | 24 | 9.13 | 1.68 | |||
| Male | Right | 26 | 9.62 | 1.41 | ||
| Left | 26 | 9.70 | 1.37 | |||
| Diabetic | Female | Right | 24 | 8.04 | 1.25 | |
| Left | 24 | 7.91 | 1.25 | |||
| Male | Right | 26 | 8.64 | 1.13 | ||
| Left | 26 | 8.64 | 1.08 | |||
| Ramus volume | Healthy | Female | Right | 24 | 1.08 | 0.33 |
| Left | 24 | 1.06 | 0.32 | |||
| Male | Right | 26 | 1.21 | 0.37 | ||
| Left | 26 | 1.22 | 0.36 | |||
| Diabetic | Female | Right | 24 | 0.83 | 0.27 | |
| Left | 24 | 0.81 | 0.24 | |||
| Male | Right | 26 | 0.89 | 0.18 | ||
| Left | 26 | 0.89 | 0.16 | |||
Ramus width: The effect of the group on ramus width was statistically significant such that the mean ramus width of healthy controls was 0.294 units higher than diabetic patients after controlling for the effect of confounders (p < 0.001).
The effect of gender on ramus width was significant such that the mean ramus width in females was 0.275 units smaller than that in males after controlling for other variables (p < 0.001).
The effect of laterality on ramus width was not significant (p = 0.719).
The effect of age on ramus width was significant such that the mean ramus width decreased by 0.051 units with each one-year increase in age after controlling for other variables (p < 0.001).
Ramus height: The effect of the group on ramus height was statistically significant such that the mean ramus height of healthy controls was 0.459 units higher than diabetic patients after controlling for the effect of confounders (p < 0.001).
The effect of gender on ramus height was not significant (p = 0.157)
The effect of laterality on ramus height was not significant (p = 0.742).
The effect of age on ramus height was significant such that the mean ramus height decreased by 0.077 units with each one-year increase in age after controlling for other variables (p < 0.001).
Ramus length: The effect of the group on ramus length was statistically significant such that the mean ramus length of healthy controls was 0.728 units higher than diabetic patients after controlling for the effect of confounders (p < 0.001).
The effect of gender on ramus length was significant such that the mean ramus length in females was 0.538 units smaller than that in males after controlling for other variables (p = 0.002).
The effect of laterality on ramus length was not significant (p = 0.900).
The effect of age on ramus length was significant such that the mean ramus length decreased by 0.051 units with each one-year increase in age after controlling for other variables (p < 0.001).
Ramus volume: The effect of the group on ramus volume was statistically significant such that the mean ramus volume of healthy controls was 0.161 units higher than diabetic patients after controlling for the effect of confounders (P < 0.001).
The effect of gender on ramus volume was significant such that the mean ramus volume in females was 0.091 units lower than that in males after controlling for other variables (p < 0.001).
The effect of laterality on ramus volume was not significant (p = 0.802).
The effect of age on ramus volume was significant such that the mean ramus volume decreased by 0.018 units with each one-year increase in age after controlling for other variables (p < 0.001).
Quality of ramus bone: GLM revealed that the effects of group (p < 0.001), gender (p < 0.001), and age (p < 0.001) on the quality of ramus bone were statistically significant such that the BMD was 45.68 units lower in diabetic patients and 32.54 units higher in males. Also, each one-year increase in age decreased BMD by an average of 6.15 units. The effect of laterality on the quality of ramus bone was not significant (p = 0.972).
Quality and quantity of harvestable bone from the palate
Table 3 presents the mean dimensions and BMD of harvestable bone from the palate.
| Table 3: Mean dimensions and BMD of harvestable bone from the palate. | ||||||
| Group | Gender | Location | N | Mean | Std. Deviation | |
| Palatal width | Healthy | Female | Right | 24 | 6.93 | 0.74 |
| Left | 24 | 6.94 | 0.77 | |||
| Male | Right | 26 | 7.21 | 0.63 | ||
| Left | 26 | 7.19 | 0.64 | |||
| Diabetic | Female | Right | 24 | 6.45 | 0.81 | |
| Left | 24 | 6.45 | 0.79 | |||
| Male | Right | 26 | 6.87 | 0.63 | ||
| Left | 26 | 6.92 | 0.61 | |||
| Palatal height | Healthy | Female | Right | 24 | 7.54 | 1.20 |
| Left | 24 | 7.53 | 1.18 | |||
| Male | Right | 26 | 8.12 | 1.12 | ||
| Left | 26 | 7.86 | 1.72 | |||
| Diabetic | Female | Right | 24 | 6.94 | 1.06 | |
| Left | 24 | 6.91 | 1.08 | |||
| Male | Right | 26 | 10.55 | 15.53 | ||
| Left | 26 | 7.41 | 0.72 | |||
| Palatal length | Healthy | Female | Right | 24 | 16.23 | 1.43 |
| Left | 24 | 16.22 | 1.43 | |||
| Male | Right | 26 | 16.71 | 1.15 | ||
| Left | 26 | 16.35 | 2.16 | |||
| Diabetic | Female | Right | 24 | 14.90 | 1.62 | |
| Left | 24 | 14.92 | 1.69 | |||
| Male | Right | 26 | 15.49 | 1.26 | ||
| Left | 26 | 15.50 | 1.27 | |||
| Palatal volume | Healthy | Female | Right | 24 | 0.88 | 0.26 |
| Left | 24 | 0.86 | 0.22 | |||
| Male | Right | 26 | 0.99 | 0.22 | ||
| Left | 26 | 0.99 | 0.22 | |||
| Diabetic | Female | Right | 24 | 0.69 | 0.22 | |
| Left | 24 | 0.69 | 0.22 | |||
| Male | Right | 26 | 1.04 | 1.25 | ||
| Left | 26 | 0.80 | 0.15 | |||
Palatal width: The effect of the group on palatal width was statistically significant such that the mean palatal width of healthy controls was 0.177 units higher than diabetic patients after controlling for the effect of confounders including age, gender, and laterality (p = 0.036).
The effect of gender on palatal width was significant such that the mean palatal width in females was 0.322 units smaller than that in males after controlling for other variables (p < 0.001).
The effect of laterality on ramus width was not significant (p = 0.934).
The effect of age on palatal width was significant such that the mean palatal width decreased by 0.030 units with each one-year increase in age after controlling for other variables (p < 0.001).
Palatal height: The effects of group (p = 0.456), gender (p = 0.133), laterality (p = 0.274) and age (p = 0.070) on palatal height were not significant.
Palatal length: The effect of the group on palatal length was statistically significant such that the mean palatal length of healthy controls was 0.638 units higher than diabetic patients after controlling for the effect of confounders (p < 0.001).
The effect of gender on palatal length was significant such that the mean palatal length in females was 0.371 units smaller than that in males after controlling for other variables (p = 0.025).
The effect of laterality on ramus length was not significant (p = 0.567).
The effect of age on palatal length was significant such that the mean palatal length decreased by 0.074 units with each one-year increase in age after controlling for other variables (p < 0.001).
Palatal volume: The effect of the group on palatal volume was not statistically significant (p = 0.957).
The effect of gender on palatal volume was significant such that the mean palatal volume in females was 0.161 units smaller than that in males after controlling for other variables (p = 0.009).
The effect of laterality on palatal volume was not significant (p = 0.295).
The effect of age on palatal volume was significant such that the mean palatal volume decreased by 0.017 units with each one-year increase in age after controlling for other variables (p < 0.001).
Quality of palatal bone: GLM revealed that the effects of group (p < 0.001), gender (p < 0.001), and age (p < 0.001) on the quality of palatal bone were statistically significant such that the BMD was 32.026 units lower in diabetic patients and 21.82 units higher in males. Also, each one-year increase in age decreased BMD by an average of 4.17 units. The effect of laterality on the quality of ramus bone was not significant (p = 0.744).
Quality and quantity of harvestable bone from the tuberosity
Table 4 presents the mean dimensions and BMD of harvestable bone from the tuberosity.
| Table 4: Mean dimensions and BMD of harvestable bone from the tuberosity. | ||||||
| Group | Gender | Location | N | Mean | Std. Deviation | |
| Tuberosity width | Healthy | Female | Right | 24 | 7.346 | 0.990 |
| Left | 24 | 7.396 | 0.948 | |||
| Male | Right | 26 | 10.911 | 16.479 | ||
| Left | 26 | 7.870 | 0.726 | |||
| Diabetic | Female | Right | 24 | 7.038 | 1.150 | |
| Left | 24 | 6.967 | 1.166 | |||
| Male | Right | 26 | 7.316 | 0.551 | ||
| Left | 26 | 7.264 | 0.507 | |||
| Tuberosity height | Healthy | Female | Right | 24 | 7.950 | 1.395 |
| Left | 24 | 7.817 | 1.348 | |||
| Male | Right | 26 | 8.041 | 1.427 | ||
| Left | 26 | 8.133 | 1.407 | |||
| Diabetic | Female | Right | 24 | 7.292 | 1.407 | |
| Left | 24 | 7.304 | 1.523 | |||
| Male | Right | 26 | 6.960 | 0.828 | ||
| Left | 26 | 6.964 | 0.826 | |||
| Tuberosity length | Healthy | Female | Right | 24 | 7.892 | 1.648 |
| Left | 24 | 8.304 | 2.332 | |||
| Male | Right | 26 | 8.330 | 1.181 | ||
| Left | 26 | 8.356 | 1.299 | |||
| Diabetic | Female | Right | 24 | 6.700 | 1.413 | |
| Left | 24 | 6.571 | 1.496 | |||
| Male | Right | 26 | 7.932 | 1.350 | ||
| Left | 26 | 7.956 | 1.348 | |||
| Tuberosity volume | Healthy | Female | Right | 24 | 0.473 | 0.177 |
| Left | 24 | 0.468 | 0.174 | |||
| Male | Right | 26 | 0.532 | 0.167 | ||
| Left | 26 | 0.539 | 0.164 | |||
| Diabetic | Female | Right | 24 | 0.360 | 0.163 | |
| Left | 24 | 0.348 | 0.147 | |||
| Male | Right | 26 | 0.409 | 0.104 | ||
| Left | 26 | 0.406 | 0.102 | |||
Tuberosity width: The effects of group (p = 0.484), gender (p = 0.204), and laterality (p = 0.321) on tuberosity width were not statistically significant.
The effect of age on tuberosity width was significant such that the mean tuberosity width decreased by 0.091 units with each one-year increase in age after controlling for other variables (p = 0.005).
Tuberosity height: The effect of the group on tuberosity height was statistically significant such that the mean tuberosity height of healthy controls was 0.412 units higher than diabetic patients after controlling for the effect of confounders (p = 0.004).
The effects of gender (p = 0.121) and laterality (p = 0.983) on tuberosity height were not significant.
The effect of age on tuberosity height was significant such that the mean tuberosity height decreased by 0.064 units with each one-year increase in age after controlling for other variables (p < 0.001).
Tuberosity length: The effect of the group on tuberosity length was statistically significant such that the mean tuberosity length of healthy controls was 0.461 units higher than diabetic patients after controlling for the effect of confounders (p = 0.017).
The effect of gender on tuberosity length was significant such that the mean tuberosity length in females was 0.707 units smaller than that in males after controlling for other variables (p < 0.001).
The effect of laterality on tuberosity length was not significant (p = 0.661).
The effect of age on tuberosity length was significant such that the mean tuberosity length decreased by 0.063 units with each one-year increase in age after controlling for other variables (p < 0.001).
Tuberosity volume: The effect of the group on tuberosity volume was statistically significant such that the mean tuberosity volume of healthy controls was 0.05 units higher than diabetic patients after controlling for the effect of confounders (p < 0.001).
The effect of gender on tuberosity volume was significant such that the mean tuberosity volume in females was 0.05 units smaller than that in males after controlling for other variables (p < 0.001).
The effect of laterality on tuberosity volume was not significant (p = 0.75).
The effect of age on tuberosity volume was significant such that the mean tuberosity volume decreased by 0.01 units with each one-year increase in age after controlling for other variables (p < 0.001).
Quality of tuberosity bone: GLM revealed that the effects of group (p < 0.001), gender (p = 0.002), and age (p < 0.001) on the quality of tuberosity bone were statistically significant such that the BMD was 33.72 units lower in diabetic patients and 20.60 units higher in males. Also, each one-year increase in age decreased BMD by an average of 5.68 units. The effect of laterality on the quality of ramus bone was not significant (p = 0.954).
This study compared the quality and quantity of bone at intraoral graft donor sites in type 2 DM patients versus healthy controls using CBCT. The results showed that the mandibular symphysis had the largest dimensions and volume of harvestable bone (mean volume of 4.57 ± 1.11 cm3) while the tuberosity had the smallest dimensions and volume of harvestable bone. The effects of age and gender on the quantity of symphyseal, ramus, palatal, and tuberosity bone were significant such that the quantity of harvestable bone from the aforementioned sites was significantly higher in males than females, and the quantity of bone decreased with age. The effect of laterality on bone quantity was not significant.
Previous studies showed that edentulous areas of the mandible had higher BMD (determined by the HU) than edentulous areas of the maxilla. Also, in both the maxilla and mandible, the anterior region had higher BMD than the posterior region [20,21]. Previous studies showed that edentulous areas of the mandible had higher BMD (determined by the Hounsfield unit) than edentulous areas of the maxilla [22]. The present results showed maximum and minimum BMD in mandibular symphysis and maxillary tuberosity, respectively, and the effects of age and gender on bone quality of the symphysis, ramus, palate, and tuberosity were statistically significant, such that the quality of bone at the aforementioned sites was higher in males than females, and bone quality decreased with age. The effect of laterality on bone quality was not significant.
Ataman-Duruel, et al. [22] in their study conducted in the United States compared the volume, dimensions, and quality of bone at different intraoral donor sites. They evaluated 50 CBCT scans of patients and analyzed the symphysis, ramus, palate, and tuberosity. The results showed that symphysis had the highest bone quality and quantity while tuberosity had the lowest bone quality and quantity. Their results were in agreement with the present findings. Gender had no significant effect on bone quality or quantity in their study. Laterality had no significant effect on bone quantity at the ramus and tuberosity but had a significant effect on the quantity of palatal bone. Bone quality was not significantly different on the right and left sides at any site. El Nahass, et al. [23] in their study conducted in Egypt measured palatal bone dimensions on 76 CBCT images and reported higher harvestable bone dimensions in the palate in males than females. Similar results were obtained in the present study such that the palatal width in females was significantly smaller than that in males but palatal height was not significantly different between males and females. The palatal length was also significantly smaller in females.
The mechanisms behind the correlation between DM and bone quality and quantity have not been well elucidated. Thus, the possible role of sex hormones, obesity, hyperglycemia, and hyperinsulinemia in this regard has been investigated; however, the pathogenesis is still not clearly understood [24]. The present results showed a significant reduction in the volume of harvestable bone at the symphysis, ramus, and tuberosity in type 2 DM patients compared with healthy controls. However, the reduction in palatal volume was not significant in diabetic patients. Also, DM significantly decreased the quality (BMD) of harvestable bone at the symphysis, ramus, palate, and tuberosity. The present results were generally in agreement with the available literature on this topic [15,25]. Rai, et al. [15] evaluated bone quality at four intraoral donor sites of diabetic patients with HbA1c ≥ 6.5% in comparison with healthy controls using CBCT. They showed lower cortical and cancellous BMD (in HU) in diabetic patients than in healthy controls. However, the difference among different age groups was not significant in BMD. Males had significantly higher cortical and cancellous BMD than females; the difference in cortical and cancellous BMD of the maxilla and mandible was also significant. Similarly, Nemtoi, et al. [25] revealed a significant inverse correlation of bone quality and quantity with the level of HbA1c and emphasized the need for assessment of bone quality and quantity of diabetic patients by CBCT prior to surgical procedures.
In the present study, only diabetic patients taking oral metformin were included in the study for the purpose of standardization. Future studies are required on diabetic patients taking other medications for DM.Diabetic patients had significantly lower bone quality and quantity at intraoral graft donor sites than healthy controls. Mandibular symphysis had higher bone volume and density than ramus, palate, and tuberosity for graft harvesting in diabetic patients. CBCT can provide valuable information regarding bone quality and quantity at the graft donor sites.
- Yavuz MS, Buyukkurt MC, Tozoglu S, Dagsuyu IM, Kantarci M. Evaluation of volumetry and density of mandibular symphysis bone grafts by three-dimensional computed tomography. Dent Traumatol. 2009 Oct;25(5):475-9. doi: 10.1111/j.1600-9657.2009.00824.x. PMID: 19754697.
- Jensen OT, Kuhlke L, Bedard JF, White D. Alveolar segmental sandwich osteotomy for anterior maxillary vertical augmentation prior to implant placement. J Oral Maxillofac Surg. 2006 Feb;64(2):290-6. doi: 10.1016/j.joms.2005.10.021. Erratum in: J Oral Maxillofac Surg. 2006 Jun;64(6):997. PMID: 16413903.
- Nkenke E, Neukam FW. Autogenous bone harvesting and grafting in advanced jaw resorption: morbidity, resorption and implant survival. Eur J Oral Implantol. 2014 Summer;7 Suppl 2:S203-17. PMID: 24977256.
- Sakkas A, Wilde F, Heufelder M, Winter K, Schramm A. Autogenous bone grafts in oral implantology-is it still a "gold standard"? A consecutive review of 279 patients with 456 clinical procedures. Int J Implant Dent. 2017 Dec;3(1):23. doi: 10.1186/s40729-017-0084-4. Epub 2017 Jun 1. PMID: 28573552; PMCID: PMC5453915.
- Spin-Neto R, Stavropoulos A, Dias Pereira LA, Marcantonio E Jr, Wenzel A. Fate of autologous and fresh-frozen allogeneic block bone grafts used for ridge augmentation. A CBCT-based analysis. Clin Oral Implants Res. 2013 Feb;24(2):167-73. doi: 10.1111/j.1600-0501.2011.02324.x. Epub 2011 Oct 21. PMID: 22093001.
- Deluiz D, Oliveira LS, Pires FR, Tinoco EM. Time-dependent changes in fresh-frozen bone block grafts: tomographic, histologic, and histomorphometric findings. Clin Implant Dent Relat Res. 2015 Apr;17(2):296-306. doi: 10.1111/cid.12108. Epub 2013 Jul 9. PMID: 23837530.
- Peleg M, Sawatari Y, Marx RN, Santoro J, Cohen J, Bejarano P, Malinin T. Use of corticocancellous allogeneic bone blocks for augmentation of alveolar bone defects. Int J Oral Maxillofac Implants. 2010 Jan-Feb;25(1):153-62. PMID: 20209198.
- Zeltner M, Flückiger LB, Hämmerle CH, Hüsler J, Benic GI. Volumetric analysis of chin and mandibular retromolar region as donor sites for cortico-cancellous bone blocks. Clin Oral Implants Res. 2016 Aug;27(8):999-1004. doi: 10.1111/clr.12746. Epub 2016 Jan 8. PMID: 26748953.
- Garg V, Giraddi GB, Roy S. Comparison of efficacy of mandible and iliac bone as autogenous bone graft for orbital floor reconstruction. J Maxillofac Oral Surg. 2015 Jun;14(2):291-8. doi: 10.1007/s12663-014-0654-4. Epub 2014 Jul 29. PMID: 26028849; PMCID: PMC4444722.
- Santhanakrishnan M, Rangarao S. Mandibular Tori: A source of autogenous bone graft. J Indian Soc Periodontol. 2014 Nov-Dec;18(6):767-71. doi: 10.4103/0972-124X.147423. PMID: 25624635; PMCID: PMC4296463.
- Reininger D, Cobo-Vázquez C, Rosenberg B, López-Quiles J. Alternative intraoral donor sites to the chin and mandibular body-ramus. J Clin Exp Dent. 2017 Dec 1;9(12):e1474-e1481. doi: 10.4317/jced.54372. PMID: 29410765; PMCID: PMC5794127.
- Ataman-Duruel ET, Duruel O, Turkyilmaz I, Tözüm TF. Anatomic Variation of Posterior Superior Alveolar Artery: Review of Literature and Case Introduction. J Oral Implantol. 2019 Feb;45(1):79-85. doi: 10.1563/aaid-joi-D-18-00056. Epub 2018 Aug 30. PMID: 30160599.
- Yildirim TT, Güncü GN, Göksülük D, Tözüm MD, Colak M, Tözüm TF. The effect of demographic and disease variables on Schneiderian membrane thickness and appearance. Oral Surg Oral Med Oral Pathol Oral Radiol. 2017 Dec;124(6):568-576. doi: 10.1016/j.oooo.2017.09.002. Epub 2017 Sep 8. PMID: 29029989.
- Katsumata A, Hirukawa A, Okumura S, Naitoh M, Fujishita M, Ariji E, Langlais RP. Relationship between density variability and imaging volume size in cone-beam computerized tomographic scanning of the maxillofacial region: an in vitro study. Oral Surg Oral Med Oral Pathol Oral Radiol Endod. 2009 Mar;107(3):420-5. doi: 10.1016/j.tripleo.2008.05.049. Epub 2008 Aug 20. PMID: 18715805.
- Rai S, Misra D, Misra A. Cone-beam computed tomography assessment of bone using grayscale values in patients with diabetes mellitus. A case-control observational study. J Indian Soc Periodontol. 2020 Nov-Dec;24(6):560-566. doi: 10.4103/jisp.jisp_719_18. Epub 2020 Nov 14. PMID: 33424174; PMCID: PMC7781243.
- Verhulst MJL, Loos BG, Gerdes VEA, Teeuw WJ. Evaluating All Potential Oral Complications of Diabetes Mellitus. Front Endocrinol (Lausanne). 2019 Feb 18;10:56. doi: 10.3389/fendo.2019.00056. PMID: 30962800; PMCID: PMC6439528.
- Surguchov A. Caveolin: A New Link Between Diabetes and AD. Cell Mol Neurobiol. 2020 Oct;40(7):1059-1066. doi: 10.1007/s10571-020-00796-4. Epub 2020 Jan 23. PMID: 31974905.
- Vestergaard P. Discrepancies in bone mineral density and fracture risk in patients with type 1 and type 2 diabetes--a meta-analysis. Osteoporos Int. 2007 Apr;18(4):427-44. doi: 10.1007/s00198-006-0253-4. Epub 2006 Oct 27. PMID: 17068657.
- Ay S, Gursoy UK, Erselcan T, Marakoglu I. Assessment of mandibular bone mineral density in patients with type 2 diabetes mellitus. Dentomaxillofac Radiol. 2005 Nov;34(6):327-31. doi: 10.1259/dmfr/52540810. PMID: 16227473.
- Turkyilmaz I, Tözüm TF, Tumer C. Bone density assessments of oral implant sites using computerized tomography. J Oral Rehabil. 2007 Apr;34(4):267-72. doi: 10.1111/j.1365-2842.2006.01689.x. PMID: 17371564.
- Turkyilmaz I, Tumer C, Ozbek EN, Tözüm TF. Relations between the bone density values from computerized tomography, and implant stability parameters: a clinical study of 230 regular platform implants. J Clin Periodontol. 2007 Aug;34(8):716-22. doi: 10.1111/j.1600-051X.2007.01112.x. PMID: 17635248.
- Ataman-Duruel ET, Duruel O, Nares S, Stanford C, Tözüm TF. Quantity and Quality of Intraoral Autogenous Block Graft Donor Sites with Cone Beam Computed Tomography. Int J Oral Maxillofac Implants. 2020 Jul/Aug;35(4):782-788. doi: 10.11607/jomi.8079. PMID: 32724932.
- El Nahass H, Naiem SN. Palatal bone dimensions on cone beam computed tomography. Implications for the palate as autogenous donor site: an observational study. Int J Oral Maxillofac Surg. 2016 Jan;45(1):99-103. doi: 10.1016/j.ijom.2015.09.006. Epub 2015 Oct 9. PMID: 26443273.
- Sert M, Tetiker T, Kirim S, Soyupak S, Canataroğlu A, Koçak M. Type 2 diabetes mellitus and osteopenia: is there an association? Acta Diabetol. 2003 Jun;40(2):105-8. doi: 10.1007/s005920300014. PMID: 12861410.
- Nemtoi A, Ladunca O, Dragan E, Budacu C, Mihai C, Haba D. Quantitative and qualitative bone assessment of the posterior mandible in patients with diabetes mellitus: a cone beam computed tomography study. Rev Med Chir Soc Med Nat Iasi. 2013 Oct-Dec;117(4):1002-8. PMID: 24502082.